What Does the Data Reveal on the Iberian Peninsula Blackout?
A Collection of Information from ENTSO-E, REE, and Experts
Note: Article was updated on 14 May with comments from Spanish Third Vice-President of the Government of Spain and Minister for Ecological Transition and Demographic Challenge Sara Aagesen following a statement in parliament that day.
On 9 May, the European Network of Transmission System Operators for Electricity (ENTSO-E) published an article on its website that an expert panel will be convened to further investigate the massive blackout on the Iberian Peninsula on 28 April 2025. In that article, the association also provided more insight into what is known from the data shortly before and at the time of the incident. This marks a fitting occasion to collect available information and to try to establish a series of events based on the data. How did the frequency develop in Spain and in the rest of Europe? How big could the loss of generation have been? And how did the Spanish and Portuguese grid operators re-power the grid?
This article gathers data from the Spanish grid operator Red Electrica (REE), from ENTSO-E, from German research organisation Fraunhofer ISE’s energy charts, and from Simon Gallagher of UK Network Services. All times are CEST times.
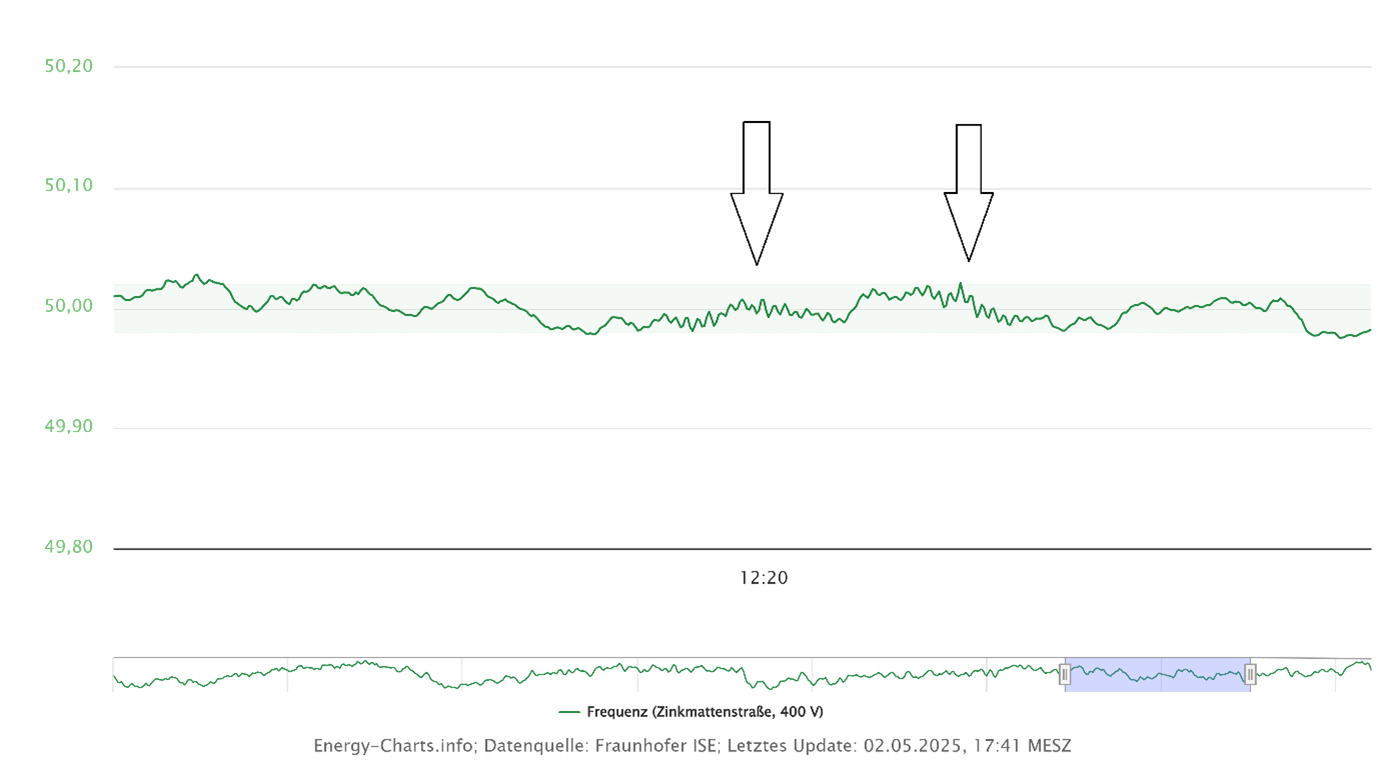
It is notable that a first drop in the frequency of the European grid occurred at 09:03. The frequency was rather unsteady at the time and left the highlighted 20 mHz corridor multiple times. At 09:03:27, the frequency dropped to a low of 49.8459 Hz.
According to ENTSO-E, two “periods of oscillation” were detected in the thirty minutes before the event. The first was between 12:03 and 12:07 while the second was between 12:19 and 12:21. The latter is clearly visible in the frequency data. According to Spanish Energy Minister Sara Aagesen on 14 May in the Spanish parliament, the origin was in central to south-west direction of the Iberian Peninsula. RTE and REE undertook unspecified mitigative actions. It is unclear what, if any, effect the oscillations had on the incident. ENTSO-E stated no oscillations occurred during the decisive seconds later.

Spain was exporting energy to its adjacent countries through all its interconnectors. At 12:30, 9 MW were exported to Andorra, 782 MW to Morocco, 2,652 MW to Portugal, and 868 MW to France. The high electricity transmission to Portugal accounted for about a third of the total load of the system which highly likely significantly contributed to the Portuguese grid collapse.
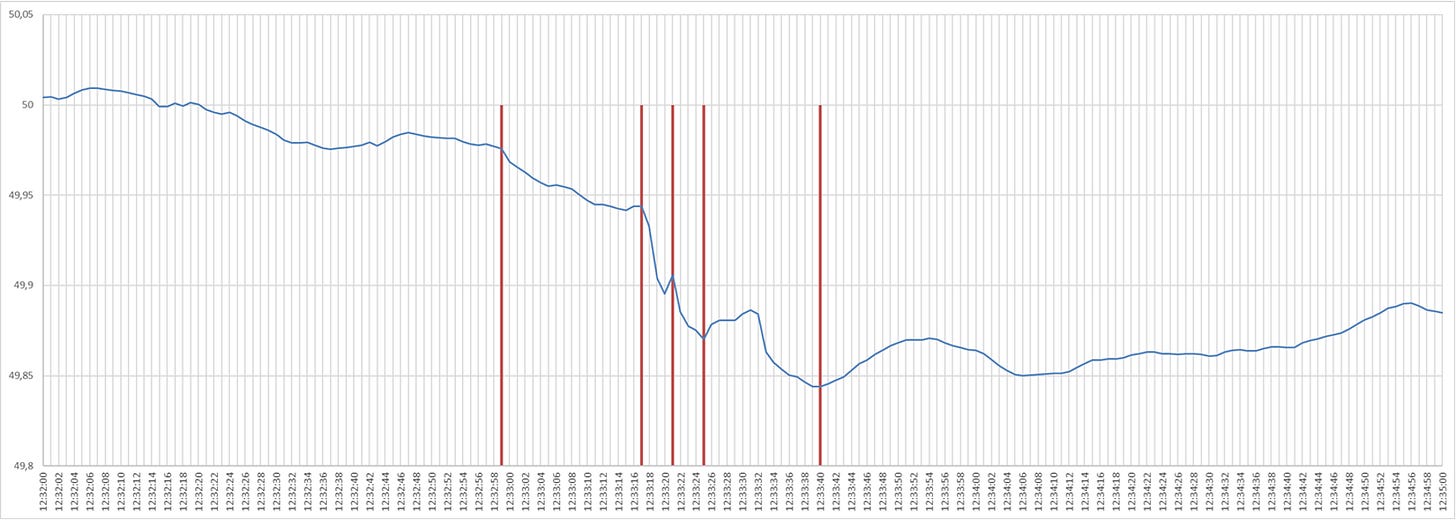
ENTSO-E stated that from 12:32:57, “a series of different generation trips were registered in the south of Spain”. The sequence lasted 20 seconds and amounted to an estimated loss of 2,200 MW. Aagesen stated that three substations failed. The first was at 12:32:57 in Granada, followed by another at 12:33:16 in Badajoz, and a third at 12:33:17 in Seville. All three locations are in south to south-western direction in Spain. Generation in France and Portugal was not affected. Frequency data from energy-charts shows a constant slide from 49.9758 Hz at 12:32:59 to 49.9439 Hz at 12:33:17. Timestamps may vary in different data sources. According to ENTSO-E, voltage increased in Spain and Portugal.
At 12:33:17, the Spanish frequency slightly dipped again and decoupled from the European grid frequency. REE stated in a conference call that an “event”, i.e. a generation loss was detected in the south-west. Aagesen confirmed a “loss of synchronisation” of the Iberian Peninsula grid with the rest of Europe. For a few milliseconds, it appeared that the grid stabilised but 1.5 seconds later, a second “event” leads to further destabilisation. Indeed, about 1.5 seconds after the initial dip, likely the first “event”, Spanish grid frequency starts to nose-dive and within four seconds, frequency crashed to 48.0 Hz. According to ENTSO-E, automatic load shedding was activated in Spain and Portugal. Aagesen stated that the first level of load shedding was activated at 12:33:20, when the Spanish grid frequency dropped to 49.5 Hz. European frequency dropped by ca. 0.05 Hz, based on energy-charts’ data.
At 12:33:21, according to ENTSO-E, the AC overhead lines between Spain and France were disconnected as a protection. After frequency data for the rest of Europe fell as a result of the Spanish frequency decrease, the European grid bounced back following the disconnection. Power was still transmitted through the HVDC lines. The European grid frequency continued to drop.
Immediately after the disconnection of the AC overhead lines, REE stated that a “massive” loss of renewable generation occurred. All generation units were then forced to disconnect in a following cascading loss of generation. According to Aagesen, six different levels of load shedding were triggered automatically. But after three seconds, at 12:33:24, the power grid on the Iberian Peninsula collapsed. The HVDC lines stopped electricity transport.
European grid frequency increased after the collapse of the Spanish grid until 12:33:31. It then dipped again from 49.8863 Hz to 49.8440 Hz at 12:33:40 which finally marked the lowest point during the incident.

The affected TSOs in Spain, Portugal, and France started a “coordinated effort” according to ENTSO-E and the restoration process started at 12:44 with a 400 kV line in the western part of the Spanish-French border being re-energised. At 13:04, the interconnector from Spain to Morocco was re-energised. The eastern part of the Spanish-French connection was re-energised at 13:35.
The incident unfolded too quickly for the generation data published by either ENTSO-E or REE to reflect it. However, REE’s data frequency is five minutes, so that a comparison from 12:30 to 12:35 is possible. Based on the data, solar photovoltaic generation dropped by 9,813 MW. The nuclear power plants were shut down automatically according to Consejo de Seguridad Nuclear (CSN), the Spanish regulator, and accounted for 3,387 MW. Hydropower lost 1,940 MW while wind farms’ output decreased by 1,357 MW. The total generation loss was 18,344 MW according to the data from REE. Exports, 4,413 MW at 12:30, dropped to zero.
In the initial recovery phase, wind and solar farms provided about 4,400 MW and 2,300 MW respectively. Hydropower plants generated another 1,000 MW with solar thermal plants, waste-fired plants, and gas-fired plants providing around 550, 500 and 300 MW.
According to ENTSO-E, several hydro power plants in Spain “with black-start capability launched their black-start processes to initiate the restoration of the system” between 12:44 and 13:30. That is not consistent with REE’s data. It rather indicates that from 15:00, hydro power plants started to increase their generation followed by gas-fired plants around 15:15 and pump-storage generation from 15:45.
In Portugal, two black start-capable power plants came operational at 16:11 and 17:26, according to ENTSO-E. It was the third attempt after the previous two failed, which underscores the complexity of black starts. Portugal’s grid operator REN was able to initiate the restoration process with two island systems.
From 17:10, REE’s transmission data shows that imports from France were restored. Imports from Morocco started again at around 18:50.
During the night, on 00:22 on the next day, the transmission grid in Portugal was restored and at around 04:00, Spain’s transmission grid restoration was completed, according to ENTSO-E’s information. That the two grid operators were able to have the grid back operational within 12 to 16 hours was a remarkable achievement. Spain’s PM Sanchez stated at around 09:00 that practically all demand was met. In Portugal, 80% of the population had regained access to electricity. It is believed to typically take up to a week to recover from a complete grid collapse, especially for a large region in Europe with 58 million citizens.


